How it measures
every 10 seconds, top takes two one-second samples (the second is the accurate one), vm_stat gives memory the way Activity Monitor counts it (app memory, wired and compressed, not the file cache), and df the disk.
About
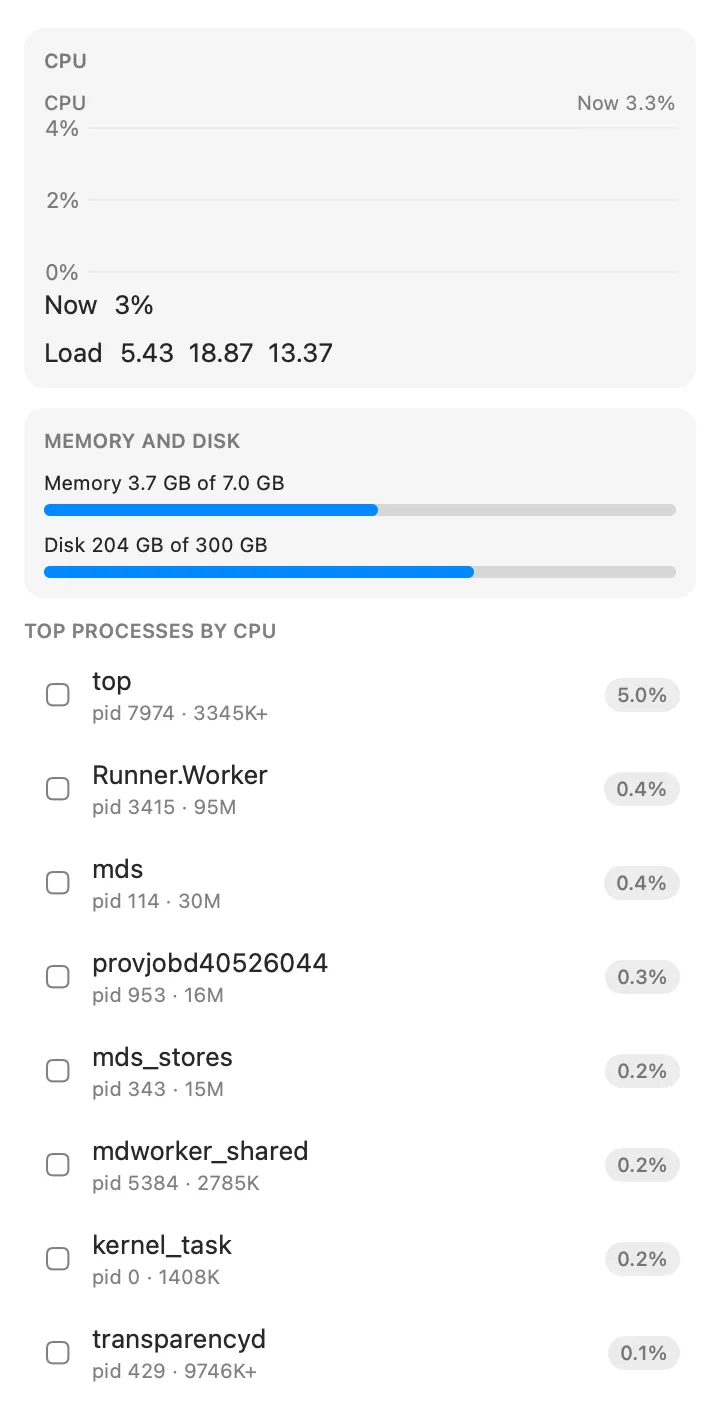
CPU and memory in the menu bar, with the processes using the most a click away.
Inside
every 10 seconds, top takes two one-second samples (the second is the accurate one), vm_stat gives memory the way Activity Monitor counts it (app memory, wired and compressed, not the file cache), and df the disk.
a CPU chart for the last five minutes, load averages, memory and disk bars, and the top eight processes, each with Copy PID and Quit Process.
what the menu bar shows (CPU and memory, CPU, or memory) and whether processes are sorted by CPU or memory.
usage returns CPU, memory, disk and the busiest processes.
Install
Don't have Stackbar yet? Download it free.
stackbarctl install --index https://navbytes.github.io/stackbar-plugins/index.json io.navbytes.stackbar.plugins.system-monitorMore monitoring